A sign in Space, Part 4: First images!
So, after looking for detectable data with lot’s of Python for some time -
with no obvious result - I thought I should look more into the spectral
analysis. So I got me that GNU Radio
Block to read the file after after
some arguing with cmake over failed dependency checks, I whipped up a very
very simple GNU Radio Graph which reads from the file and dumps it with no
post-processing to a FFT Waterfall Sink:
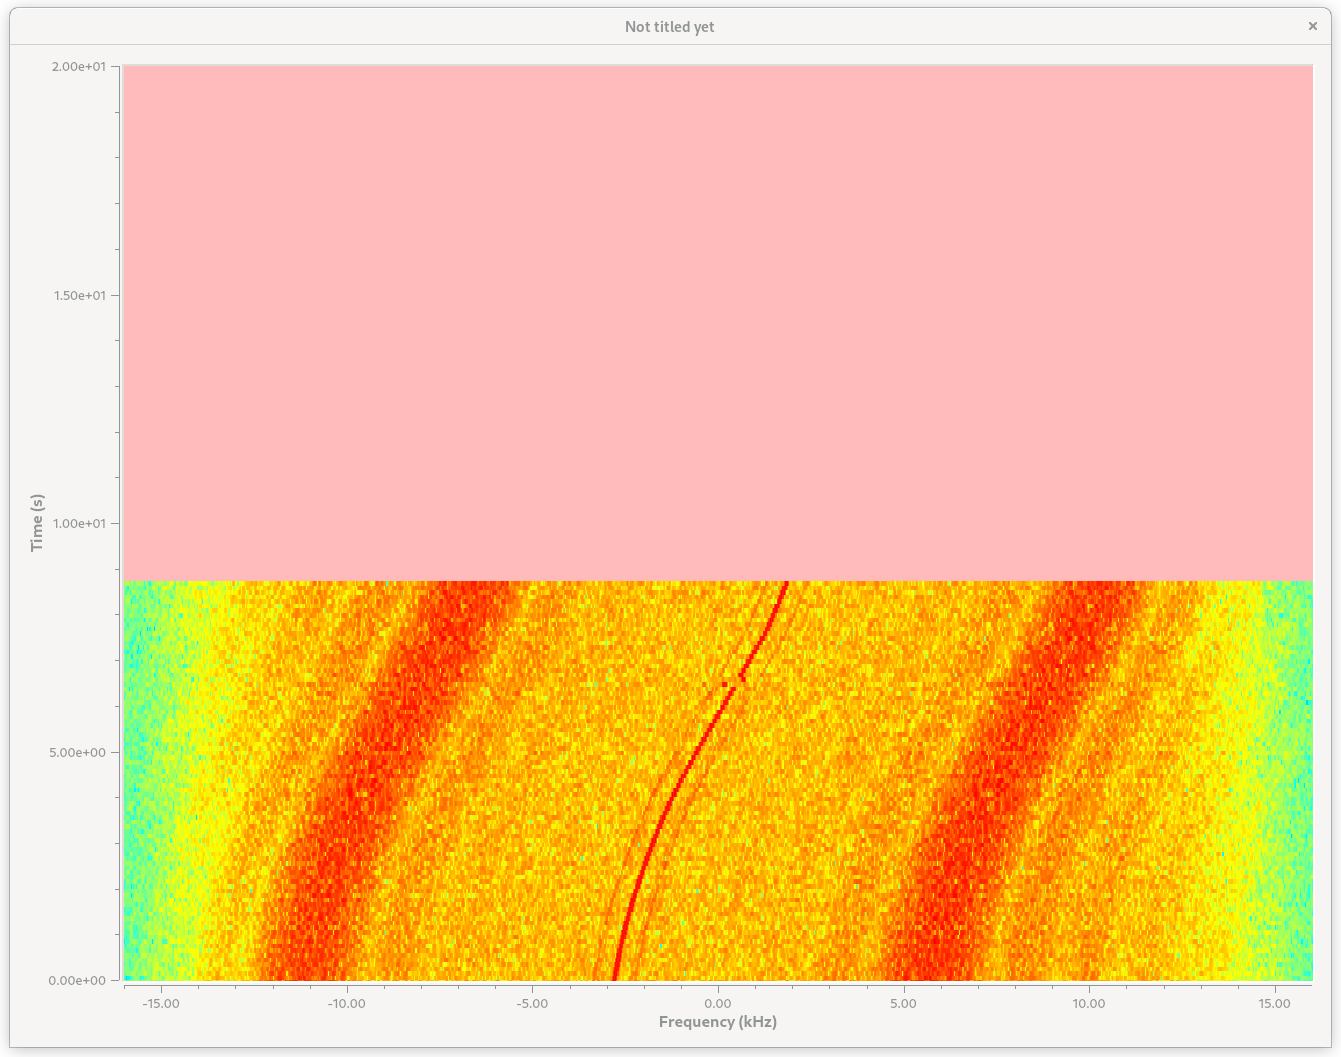
Woohooo! OK, let’s quickly discuss what we see here.
- We’re seeing a signal in the middle - the center frequency - which is usually an artifact from the local oscillator. It’s not really “real” in the strict sense. At least with my lousy setups…
- What looks real, are the two bright signals about .5 kHz up and down the main (perhaps fake signal). But I can’t make out any details here. Do not forget, this many minutes long transmission has been compressed to this tiny picture.
- What is odd are the strong signals +- 8 kHz up and down of the center frequency. The bandwidth is just way to high to be “just” harmonics.
- We can also very vividly see how the center frequency drifts - this is owed to the Doppler-effect - it was sent from a spacecraft orbiting Mars, Mars is orbiting the Sun, it was received on Earth which is rotating around it’s axis and Earth is also revolving around the Sun. So it’s not surprising that the differences in relative velocity make the signal drift.
The GRC Graph is a pretty simple one, look:
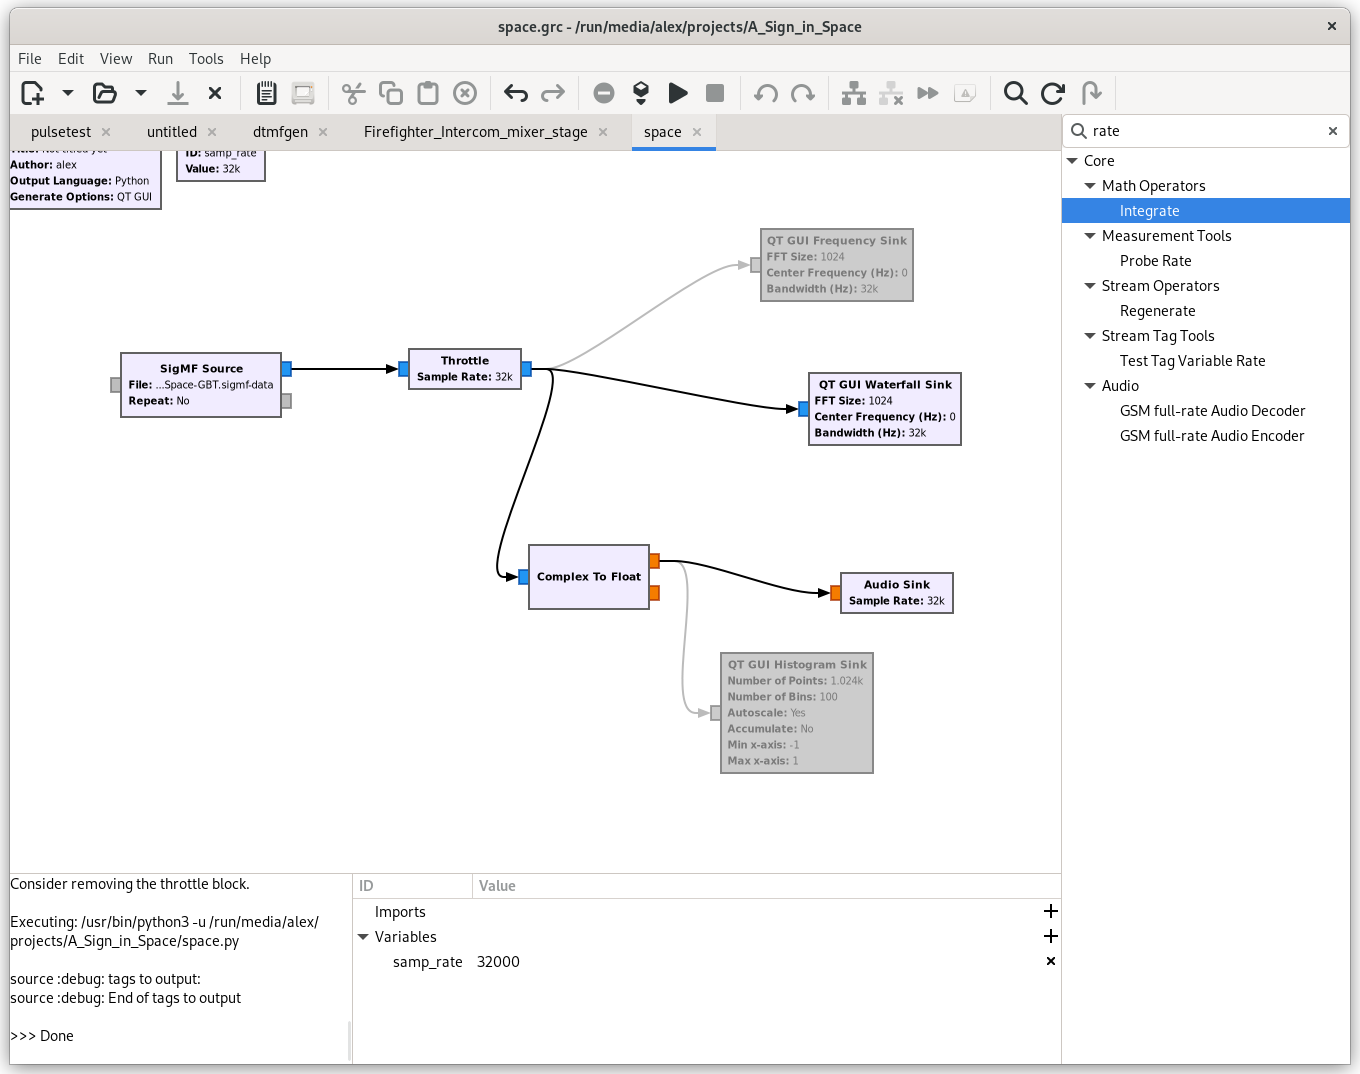
OK, now let’s zoom in a little. I added a Throttle, and for the fun, an audio sink, fiddled around with the FFT size, color scheme and whatnot, and this is what I got:
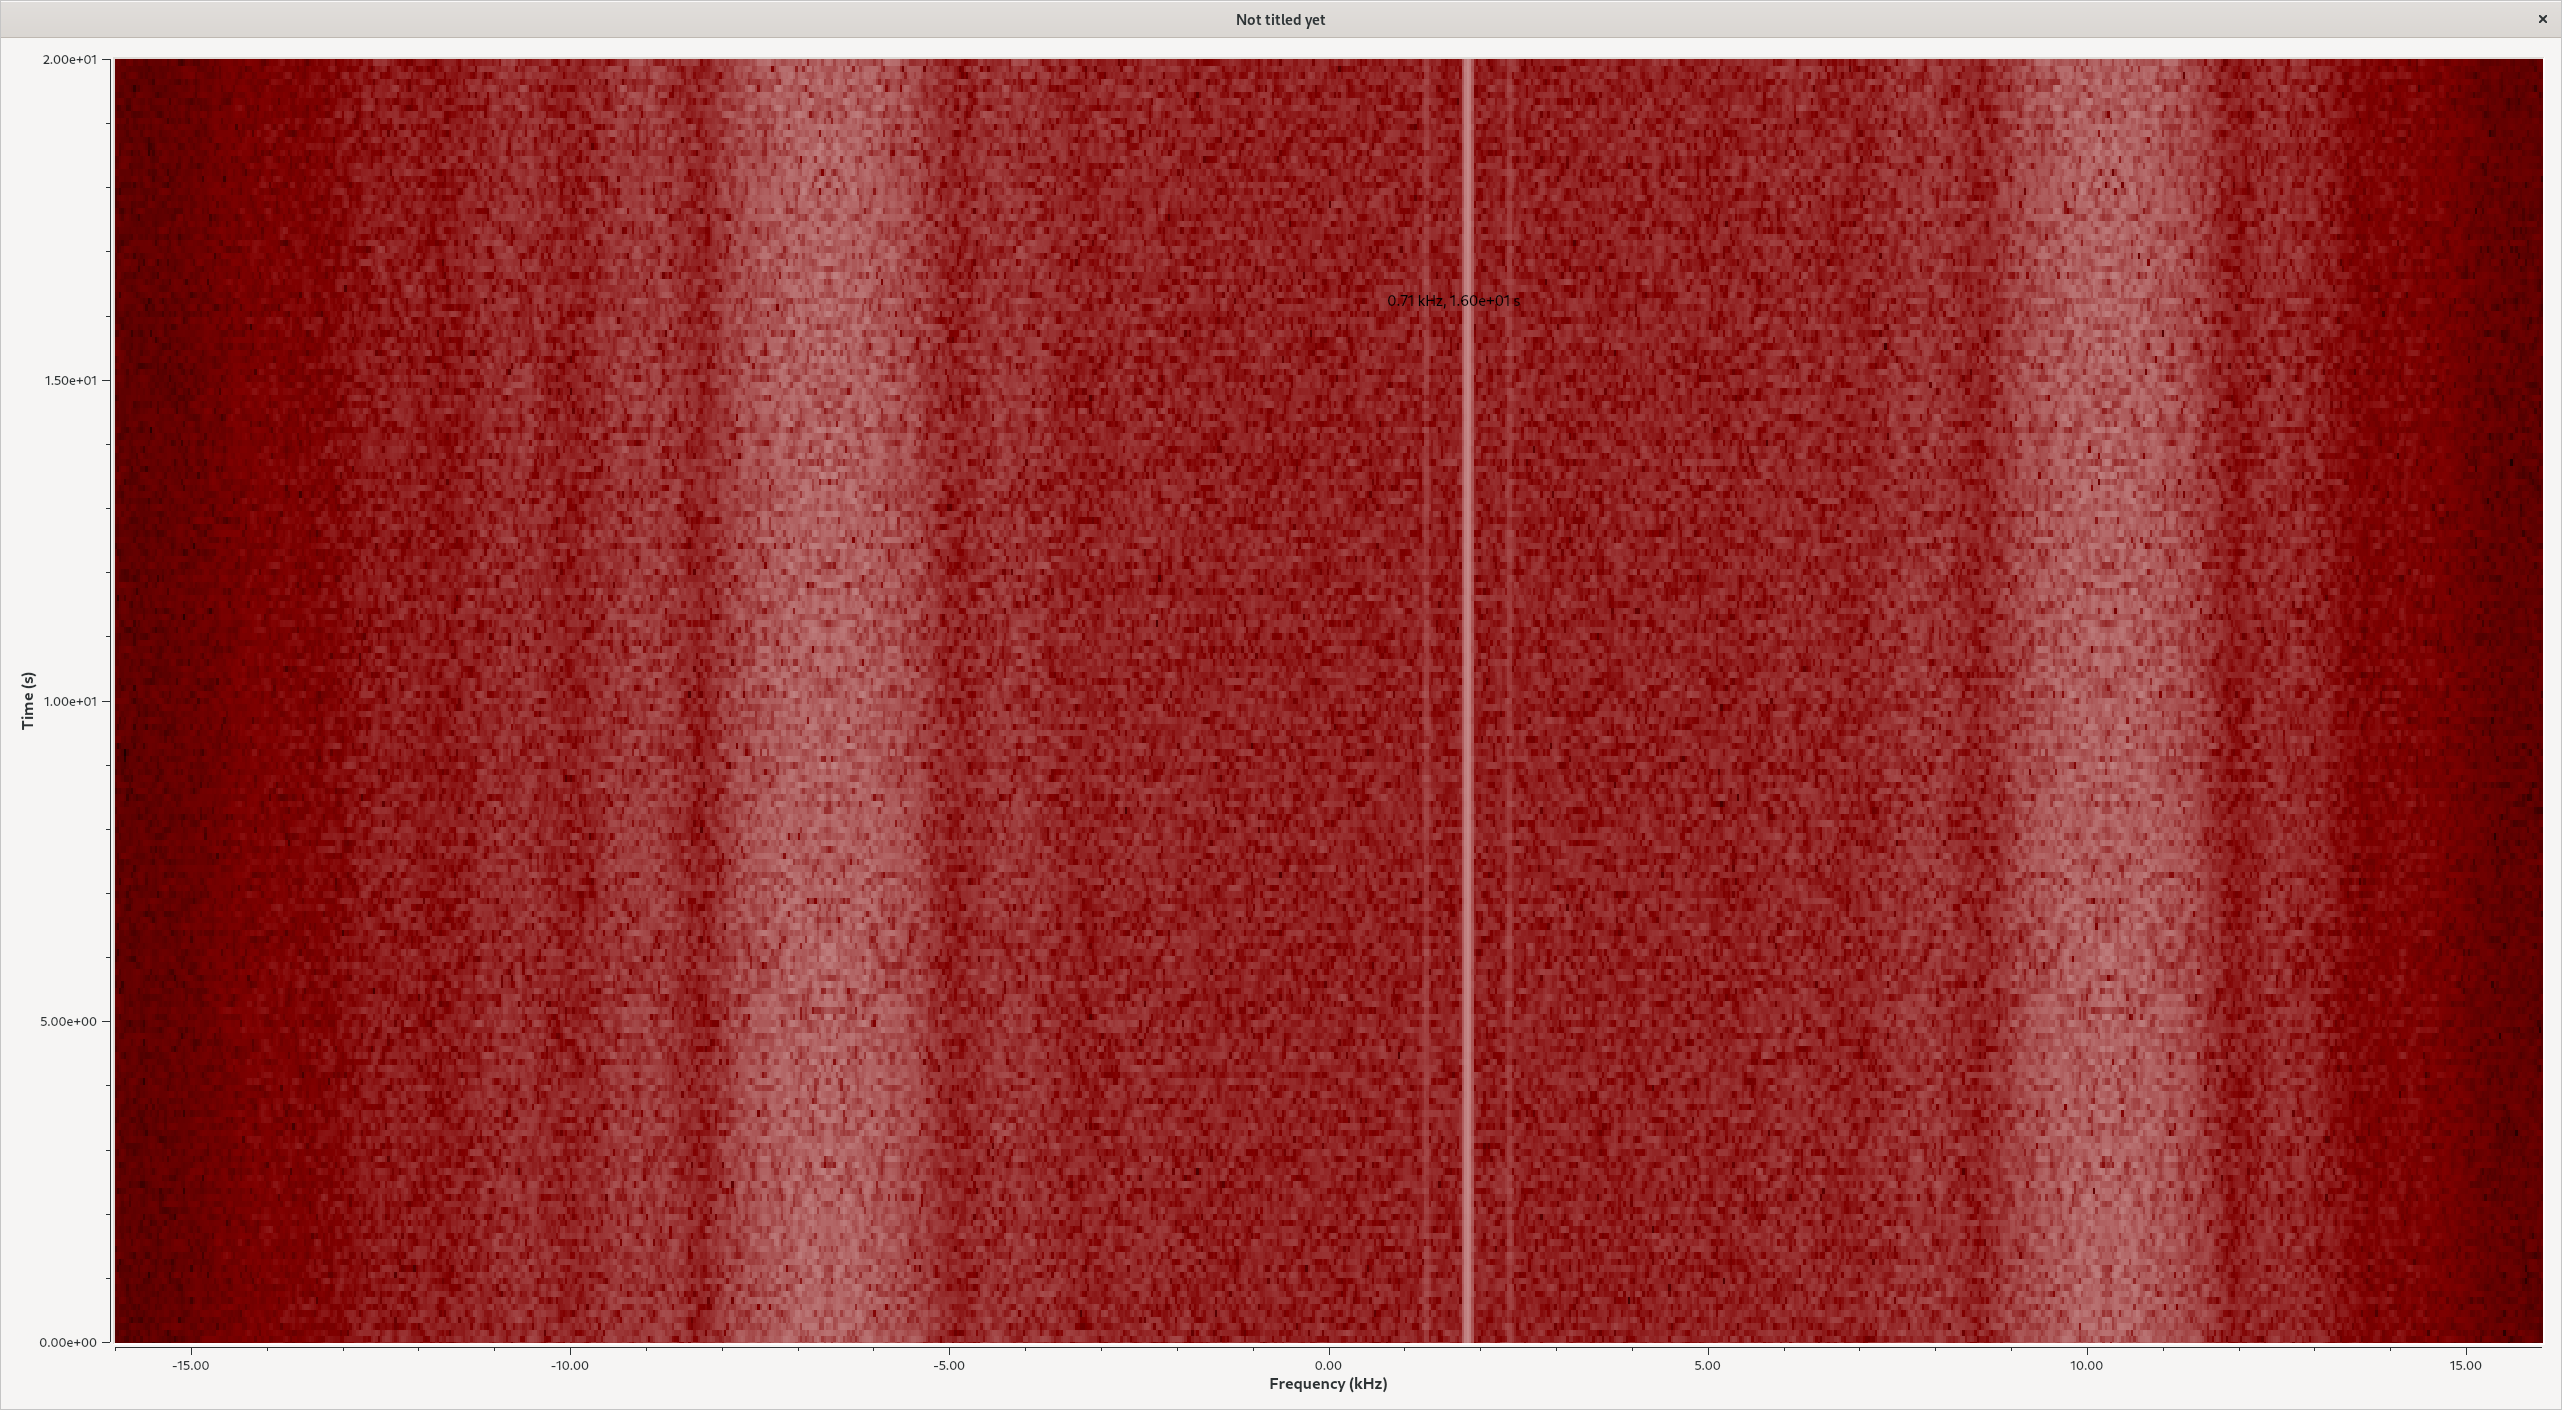
I don’t know about you, but I think I’m starting to either suffer from pareidolia - I looked at FFTs for almost an hour - or can one really see figurines holding up their hands? :-)
I don’t know, but for tonight I call it a day.